App Usage Analytics Dashboard
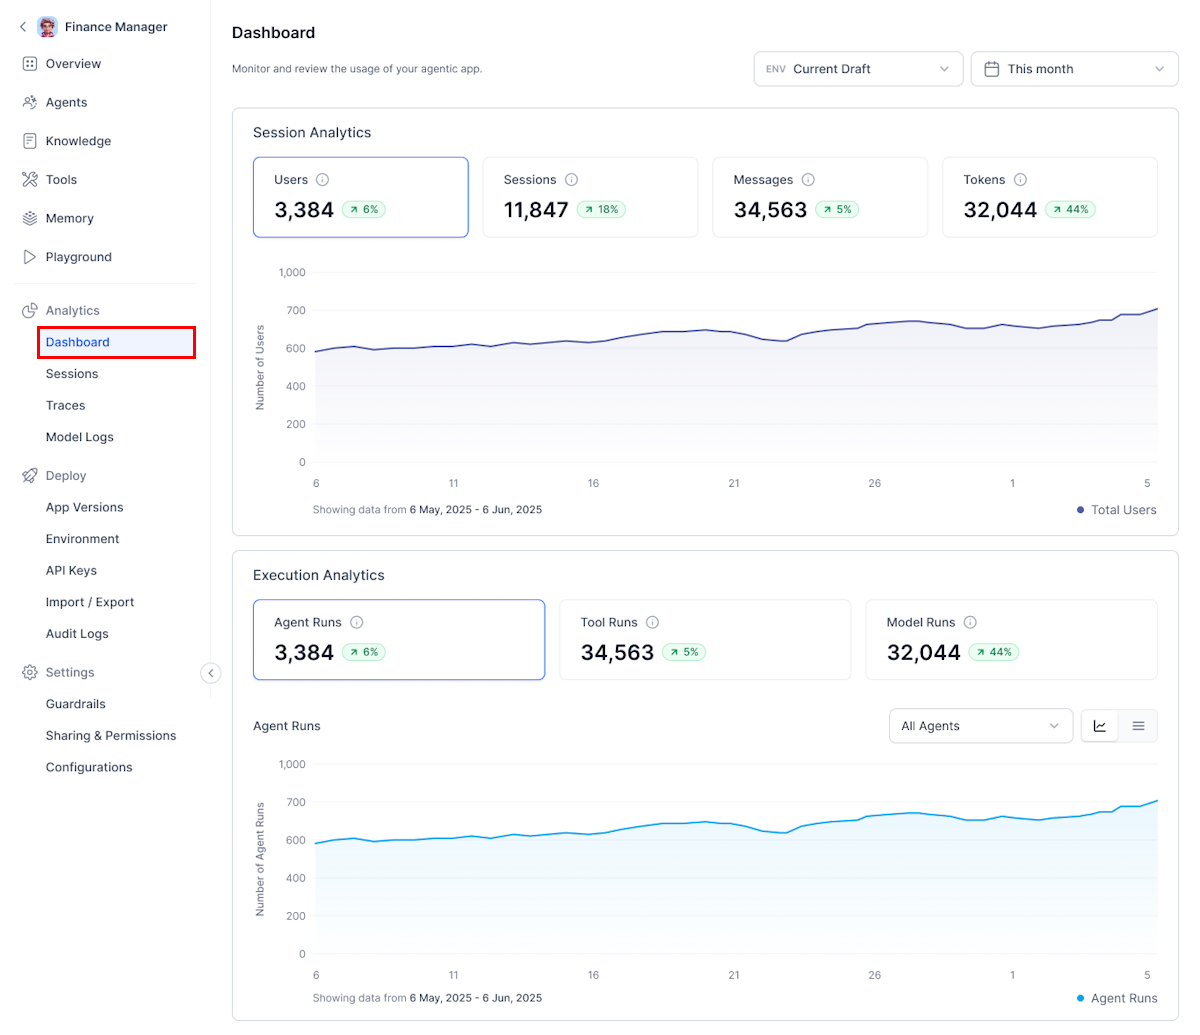
The Analytics Dashboard provides real-time insights into app usage with comprehensive visibility into user engagement, performance metrics, and resource utilization for agents, tools, and models.
The dashboard organizes analytics into two primary categories:
- Session-level insights: User activity and engagement metrics.
- Run-level insights: Execution performance and resource consumption.
Key Features
- Real-time data updates.
- Customizable timeframe and environment filters.
- Trend analysis with historical comparisons.
- Interactive visualizations with detailed drill-down capabilities.
- The default view displays the current draft environment.
Navigation and Controls
Customize the analytics view by using the dashboard's filtering options and interactive controls.
- Time Frame Selection: Choose from pre-defined ranges or set custom dates to analyze specific periods.
- Environment Filter: Select specific environments for targeted analysis (defaults to current draft).
- Environment Filter Label: Displays a visible label for the Environment filter to improve discoverability.
- View Modes: Toggle between interactive charts for trend analysis and detailed tables for granular inspection.
- Drill-down Navigation: Click any metric card or data point to access expanded insights and detailed breakdowns.
- Export Options: Download data for offline analysis and custom reporting.
Key Metrics and Components
Session Metrics
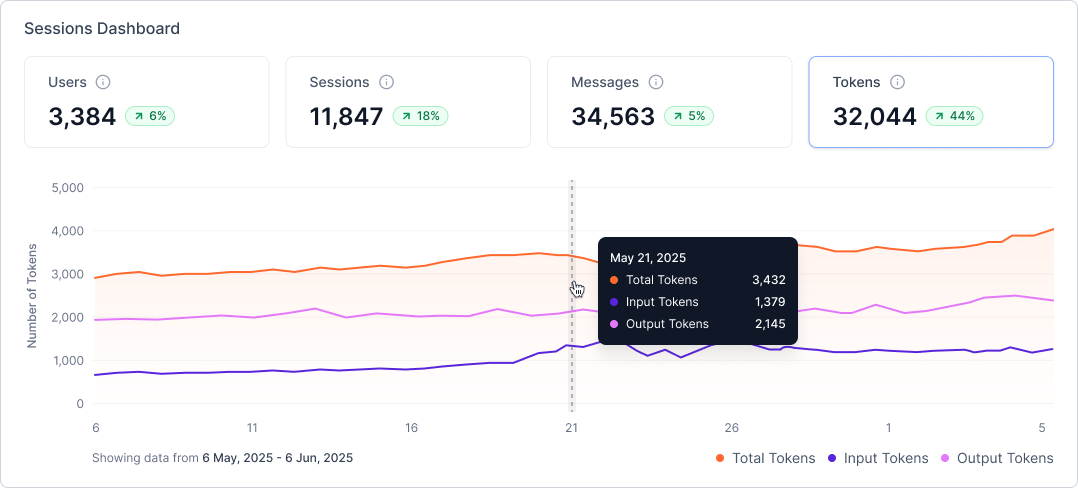
The dashboard's top section, displays four key performance indicators, each featuring:
- Current value with real-time updates
- Percentage change from the previous period
- Visual trend indicators
- Interactive time-series charts
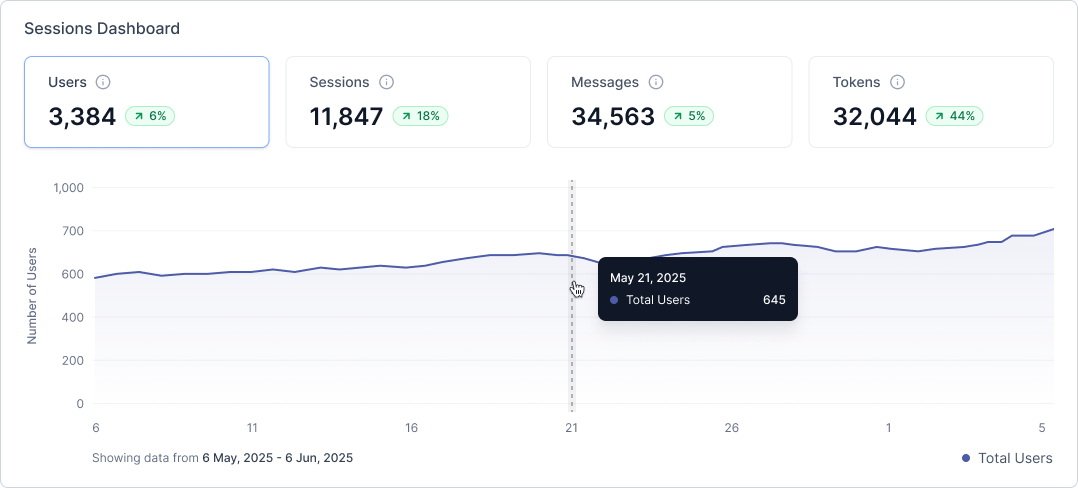
Users
Tracks unique active users within the selected timeframe, displaying:
- Total user count
- Period-over-period comparison
- Daily or hourly activity breakdown
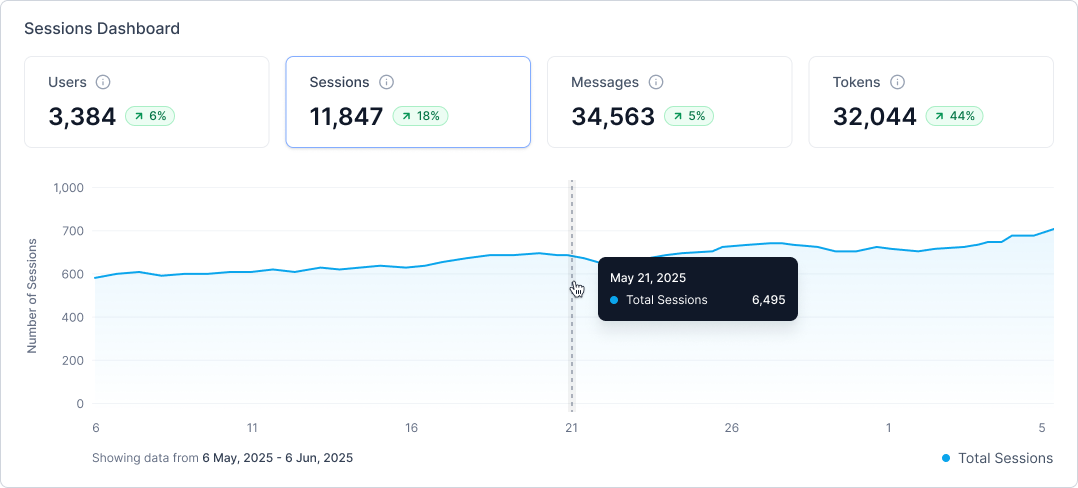
Sessions
Monitors total session volume, including:
- Session count and trends
- Historical performance comparison
- Time-based distribution chart
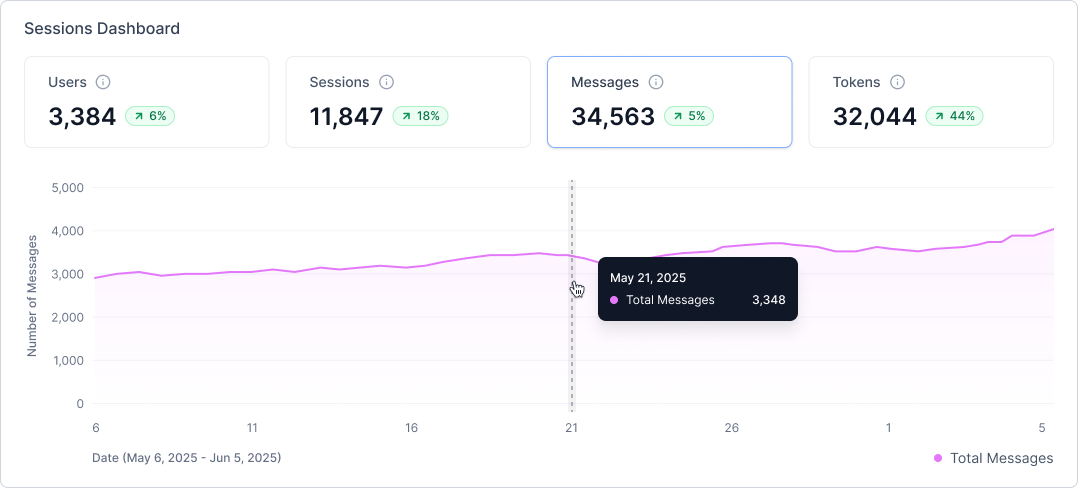
Messages
Measures communication volume between users and the system:
- Total input and output message counts
- Comparative trend analysis
- Hourly and daily volume breakdowns
Tokens
Tracks token consumption across Agent and Supervisor components:
- Total tokens consumed
- Usage comparison with previous periods
- Time-based consumption patterns
Run Analytics
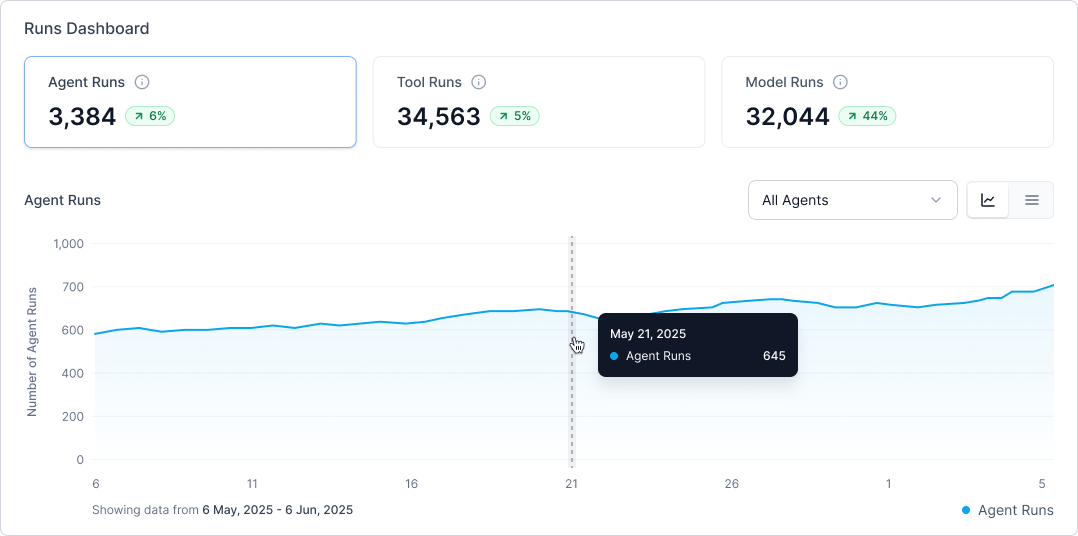
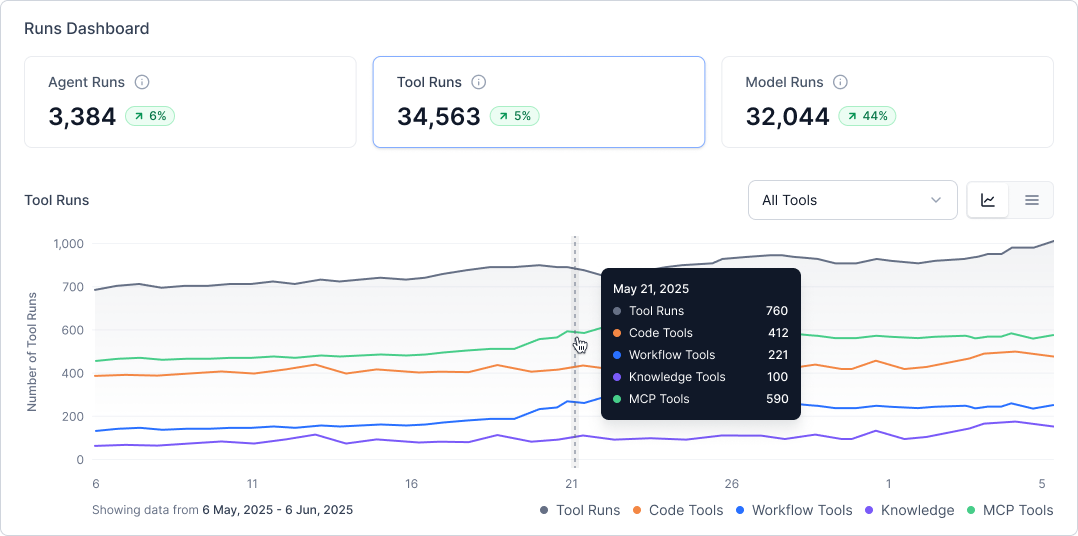
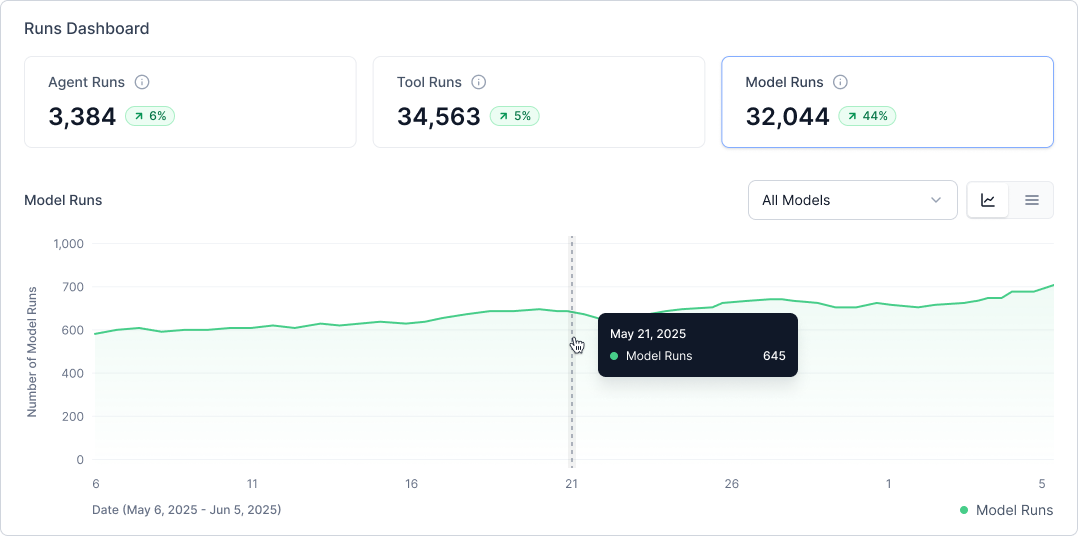
The Runs section provides detailed execution metrics across three component categories, available in both chart and tabular formats.
Agent Runs
Monitors agent execution performance with:
- Total execution count and trends
- Performance metrics over time
- Detailed agent-level data: Agent name, Number of runs, Average response time, and Token consumption
Tool Runs
Analyzes tool utilization across all agents:
- Execution counts with trend indicators
- Breakdown by tool type: Workflow, Code, MCP (Model Context Protocol), and Knowledge
- Tool-specific metrics: Tool name, Run frequency, Average response time, and Tool category
Model Runs
Tracks model API calls from Agents and Supervisors:
- Total model invocations
- Performance trends over time
- Model-level details: Model name, Execution count, Average response time, and Token usage
